
Performance
MCA Spring 2022 Results
St. Croix Prep vs State-Wide Results
Math
Reading
Science
St. Croix Prep
79.0%
82.2%
74.7%
Minnesota
45.5%
51.7%
41.3%
Difference
33.5%
30.5%
33.4%
MCA Spring 2021 Results
St. Croix Prep vs State-Wide Results
Math
Reading
Science
St. Croix Prep
73.5%
86.6%
75.7%
Minnesota
44.2%
52.5%
43.1%
Difference
29.3%
34.1%
32.6%
MCA Spring 2021 Results
St. Croix Prep Divisions vs State-Wide Results
Math
Reading
Science
Lower School
93.6%
83.8%
n/a
Middle School
64.6%
86.6%
78.0%
Upper School
67.5%
91.5%
71.6%
Minnesota
44.2%
52.5%
43.1%
Since its inception, St. Croix Prep has been one of Minnesota’s highest performing schools. Its MCA results are consistently in the state’s top 10%, usually exceeding state proficiency percentages by 20 percentage points. In addition, approximately 60% of the graduating seniors receive acceptance to a selective or highly selective college/university.
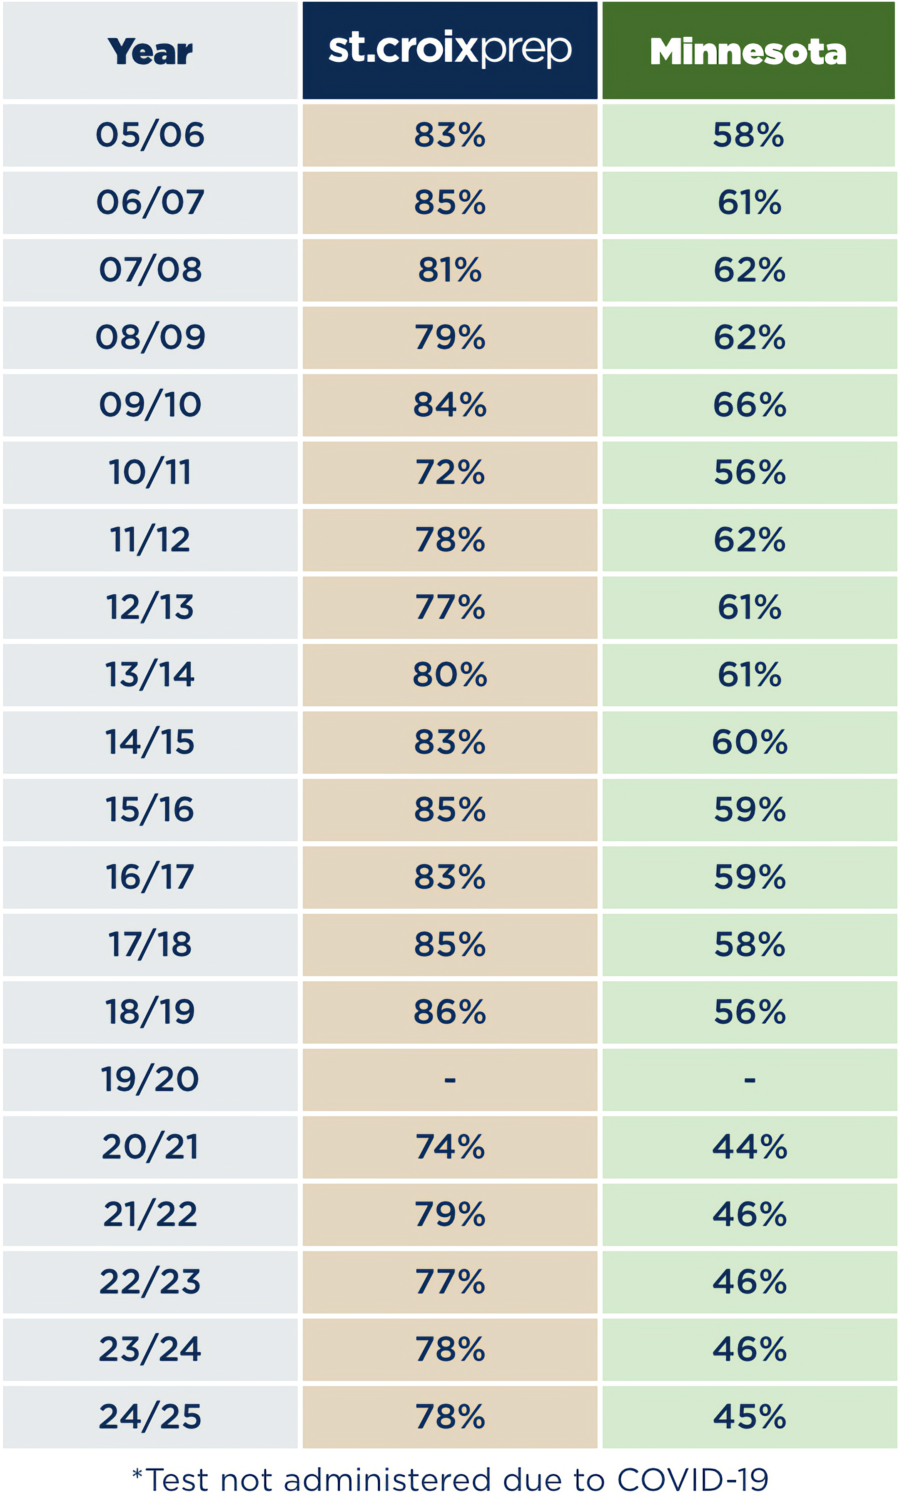
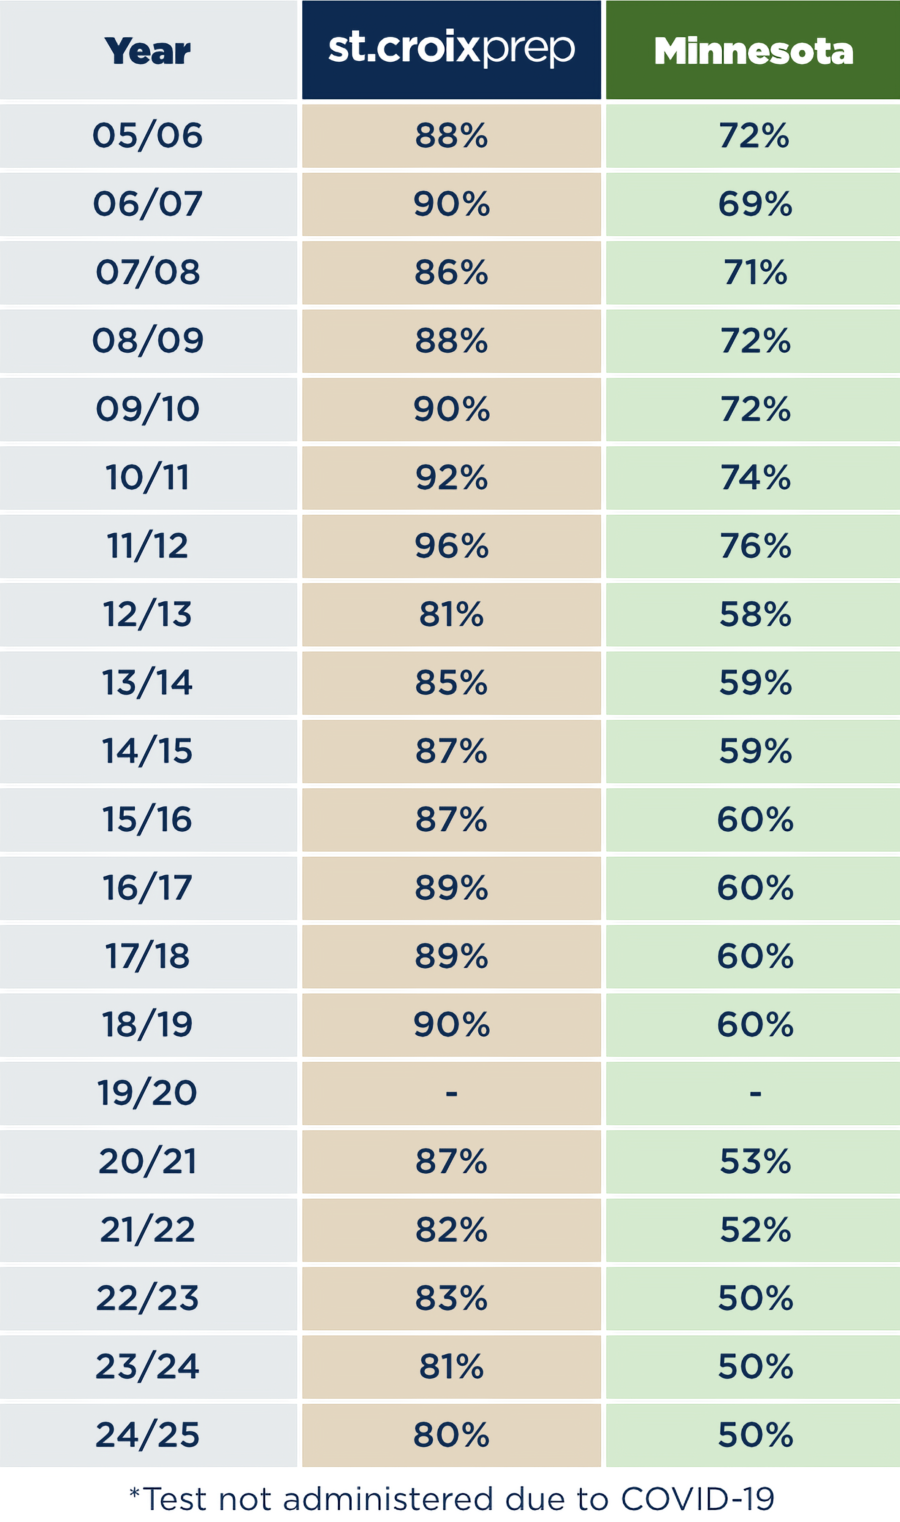
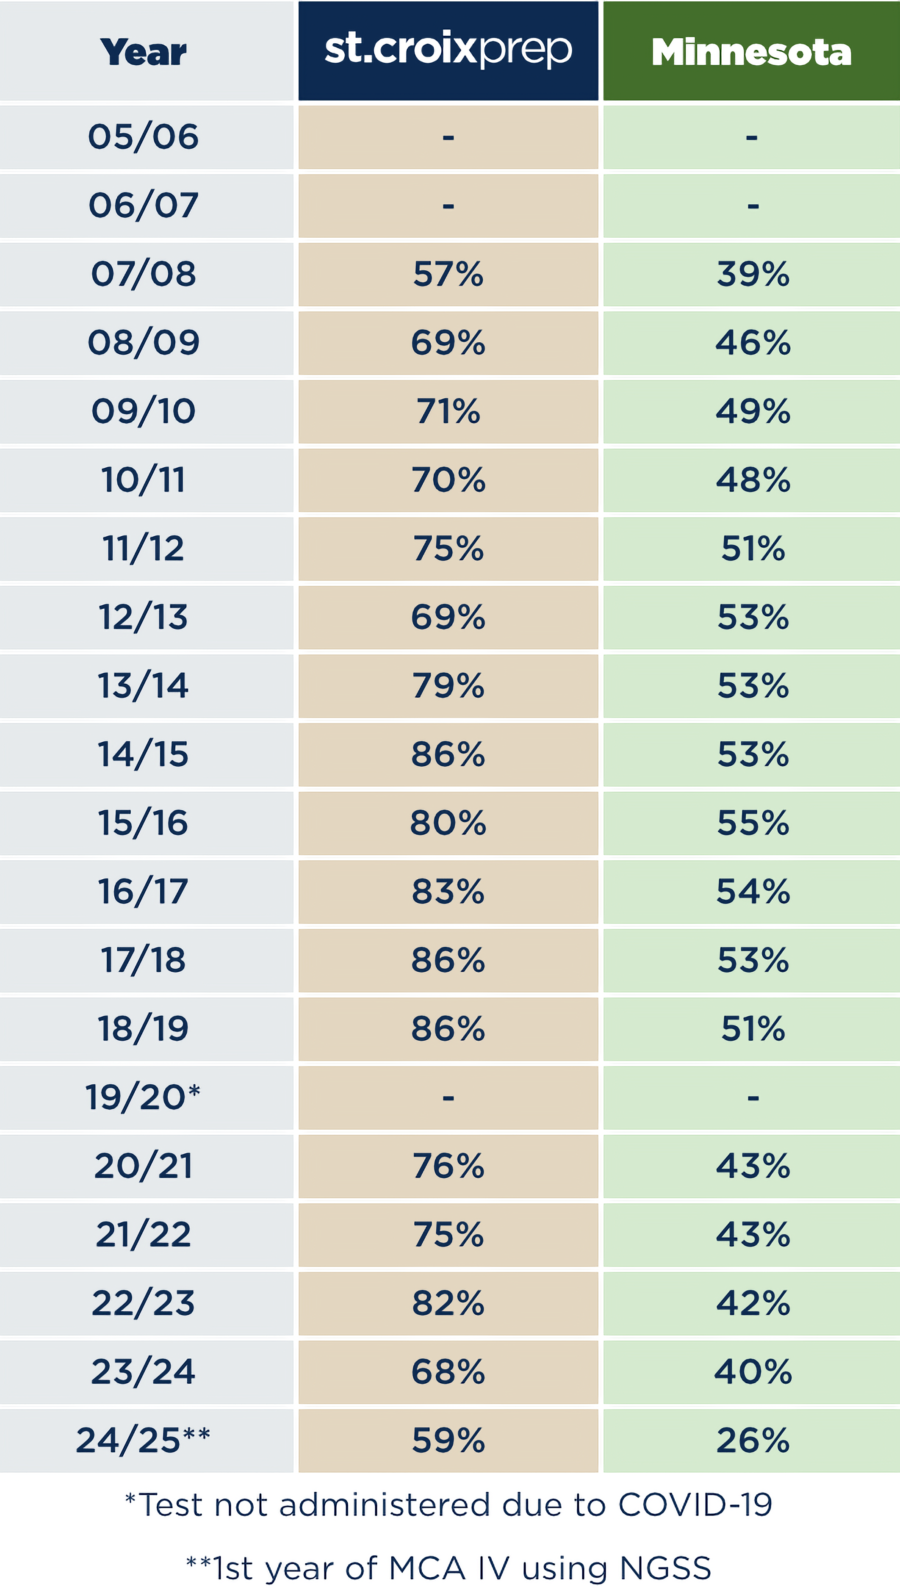
Math
2021-2022 | MN Average – 45.5% | SCPA – 79.0%
2019-2020 | Due to COVID-19, MCA Tests were not administered
2018-2019 | MN Average – 55.5% | SCPA – 85.8%
2017-2018 | MN Average – 58% | SCPA – 85%
2016-2017 | MN Average – 59% | SCPA – 83%
2015-2016 | MN Average – 60% | SCPA – 85%
2014-2015 | MN Average – 60% | SCPA – 83%
2013-2014 | MN Average – 61% | SCPA – 80%
2012-2013 | MN Average – 61% | SCPA – 77%
2011-2012 | MN Average – 62% | SCPA – 78%
2010-2011 | MN Average – 56% | SCPA – 71%
2009-2010 | MN Average – 66% | SCPA – 84%
2008-2009 | MN Average – 62% | SCPA – 79%
2007-2008 | MN Average – 62% | SCPA – 81%
2006-2007 | MN Average – 61% | SCPA – 85%
2005-2006 | MN Average – 58% | SCPA – 83%
Reading
2021-2022 | MN Average – 51.7% | SCPA – 82.2%
2019-2020 | Due to COVID-19, MCA Tests were not administered
2018-2019 | MN Average – 59.7% | SCPA – 90%
2017-2018 | MN Average – 60% | SCPA – 89%
2016-2017 | MN Average – 60% | SCPA – 89%
2015-2016 | MN Average – 60% | SCPA – 87%
2014-2015 | MN Average – 59% | SCPA – 87%
2013-2014 | MN Average – 59% | SCPA – 85%
2012-2013 | MN Average – 58% | SCPA – 81%
2011-2012 | MN Average – 76% | SCPA – 96%
2010-2011 | MN Average – 74% | SCPA – 92%
2009-2010 | MN Average – 72% | SCPA – 90%
2008-2009 | MN Average – 72% | SCPA – 88%
2007-2008 | MN Average – 71% | SCPA – 86%
2006-2007 | MN Average – 69% | SCPA – 90%
2005-2006 | MN Average – 72% | SCPA – 88%
Science
2021-2022| MN Average – 41.3% | SCPA – 74.7%
2019-2020 | Due to COVID-19, MCA Tests were not administered
2018-2019 | MN Average – 50.7% | SCPA – 85.6%
2017-2018 | MN Average – 53% | SCPA – 86%
2016-2017 | MN Average – 54% | SCPA – 83%
2015-2016 | MN Average – 55% | SCPA – 80%
2014-2015 | MN Average – 53% | SCPA – 86%
2013-2014 | MN Average – 53% | SCPA – 79%
2012-2013 | MN Average – 53% | SCPA – 69%
2011-2012 | MN Average – 51% | SCPA – 75%
2010-2011 | MN Average – 48% | SCPA – 70%
2009-2010 | MN Average – 49% | SCPA – 71%
2008-2009 | MN Average – 46% | SCPA – 69%
2007-2008 | MN Average – 39% | SCPA – 57%
Note: St. Croix Prep has maintained its philosophical emphasis of aligning its classroom instruction with its curriculum and not focusing any classroom instruction on standardized test preparation. Our proficiency percentages are for the entire school (K-12). Media presentation of statewide results often break out scores by a district’s elementary (K-5; K-6), middle school/junior high (6-8; 6-9), and high schools (9-12; 10-12).
School Report Cards
Each year the Minnesota Department of Education (MDE) issues a report card on each school. The School’s report cards may be found here:
The report cards show test results, graduation rates, demographics, staffing profile, student progress, academic standards, etc.
Authorizer